A Data Forward Philosophy
The information age has produced a ubiquity of data, most of which goes un-used. Data can drive business decisions, support or refute intuitive claims, and help us to live in a fact forward world. As a data scientist and engineer I am adept at data manipulation and visualization. I have experience with experiment design, structured and unstructured data processing, and machine learning tools allowing me to question the reliability of data sets and interrogate them using cutting edge techniques. My work in data science is diverse but maintains a common focus on human well being and environmentalism.
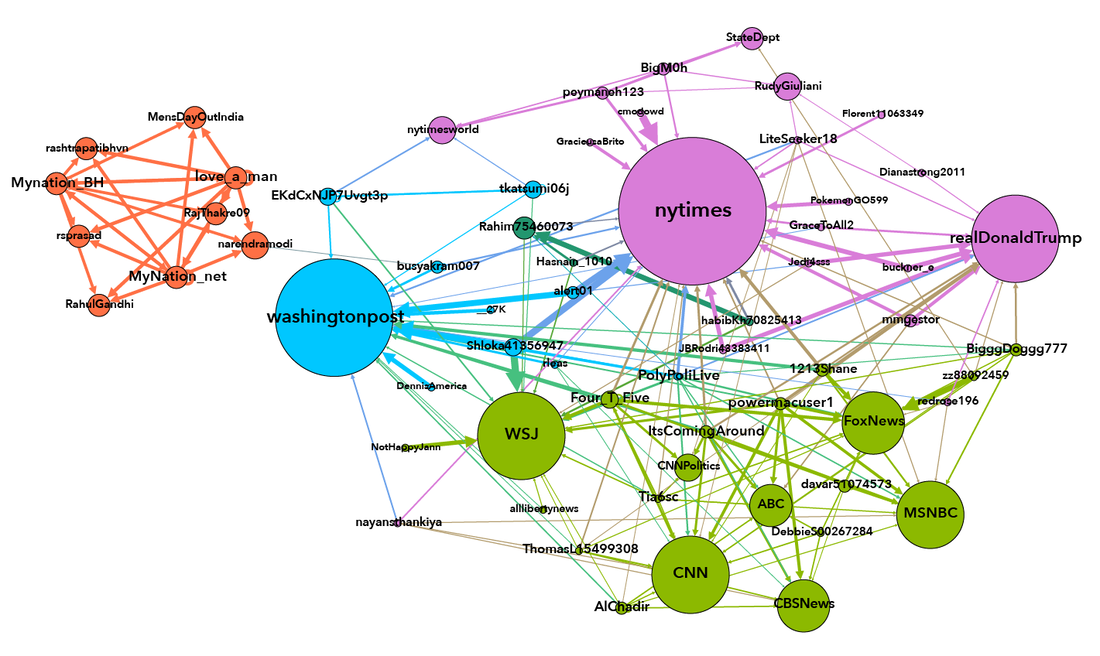
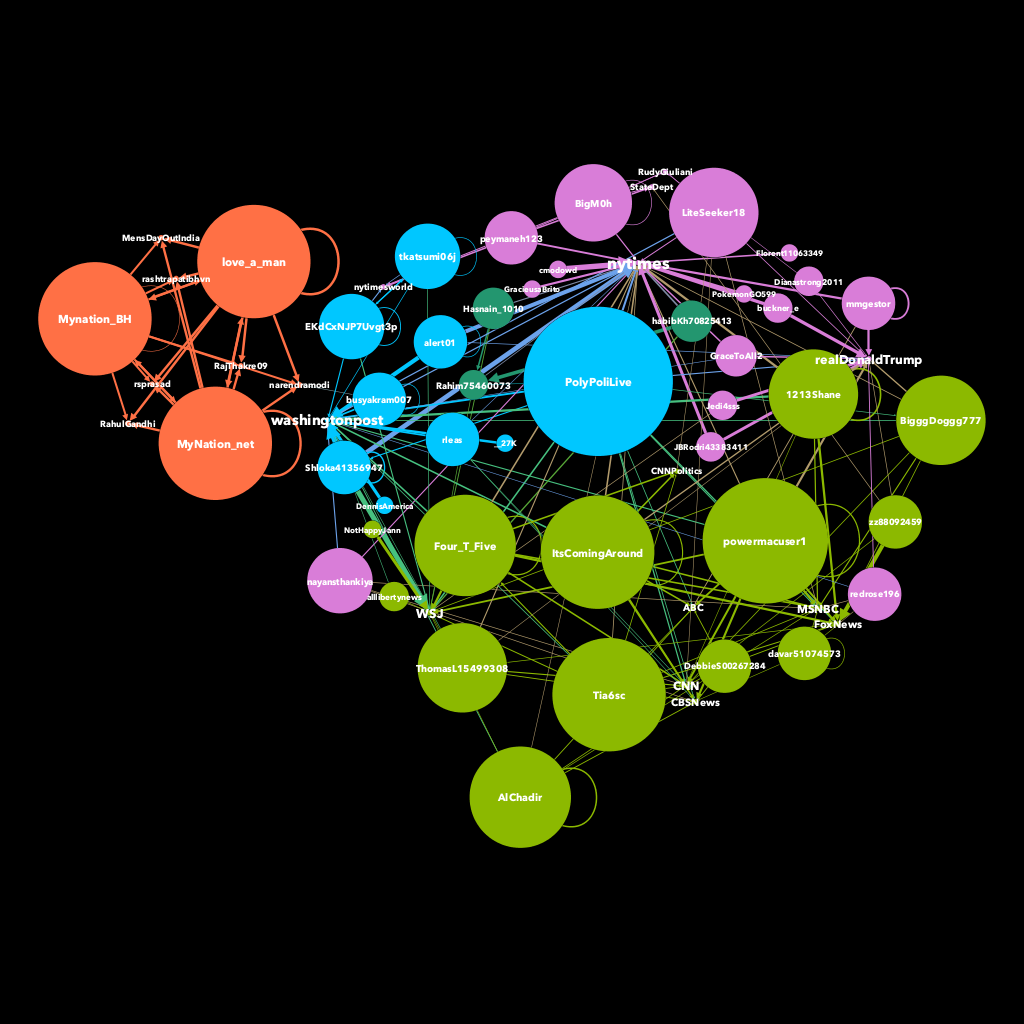
Studying Social Media Influence Among Political News ORganizations Using Network Analysis
Network analysis is a powerful way to visualize the interrelationships between entities. In this analysis, I used python tools to scrape twitter data from the Wall Street Journal, New York Times, Fox News and Washington Post. I mapped out the news organization's engagements with each other, their relative level of influence, and visualize the followers most vocal and devoted to each organization. Cluster analysis was used to group nodes by color and bot detection algorithms were used to exclude accounts that exhibited automated behavior. Semantic analysis was also performed to identify trends in the topics most discussed by each organization; that analysis and the resulting network maps can be found in the code notebook linked below.
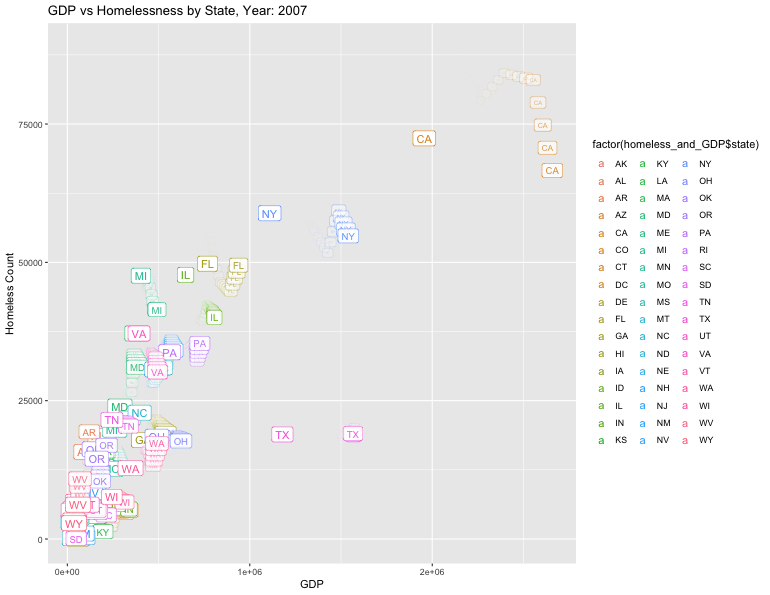
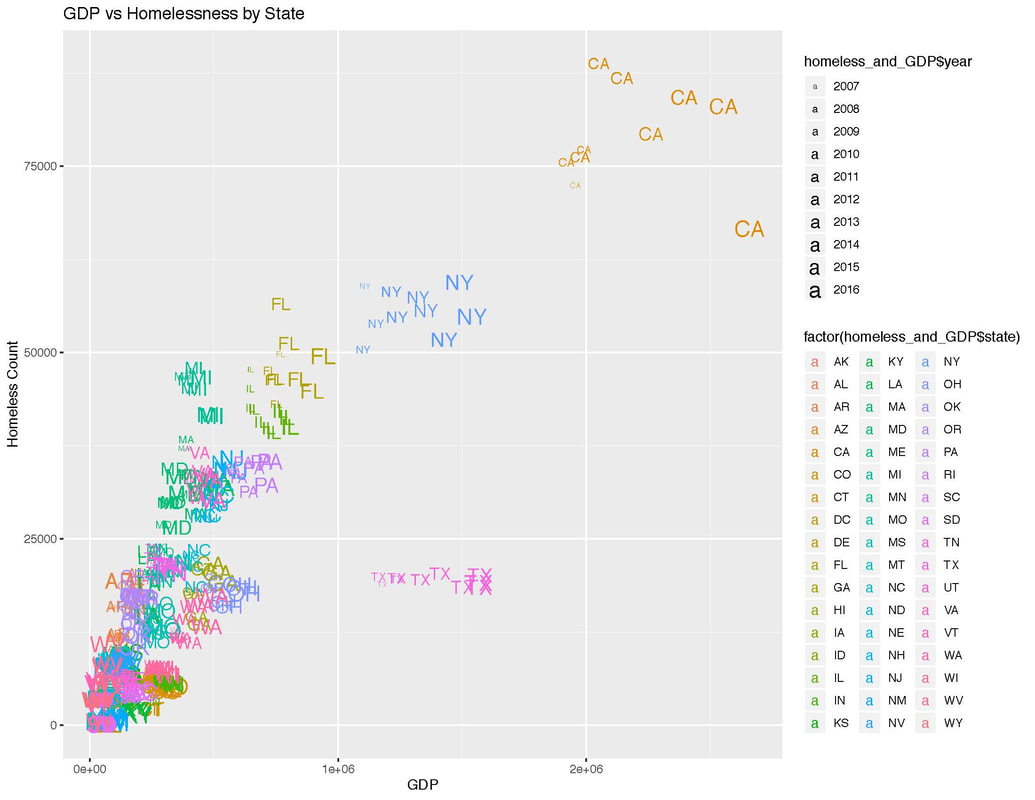
Economic and Public Health Predictors of Homelessness
The plots below show how U.S. homelessness and GDP vary by state through time. Between 2007 and 20016, GDP steadily rose in almost every US state, but homelessness varied widely over this time. The dynamic and static visualization below along with further analysis show that homelessness is largely independent of macroeconomic trends and that multiple factors taken together such as public health data, housing prices, and homelessness legislation are stronger predictors of homelessness in years to come.
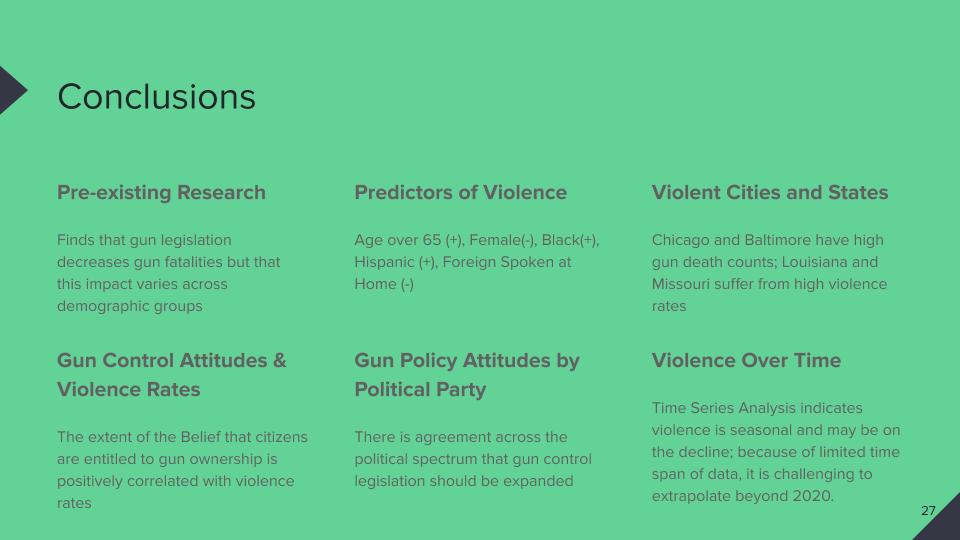
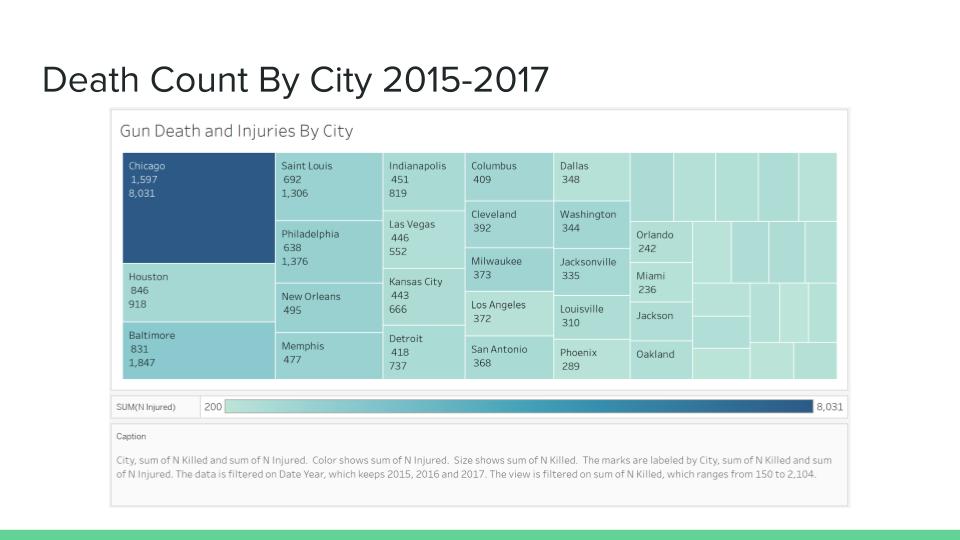
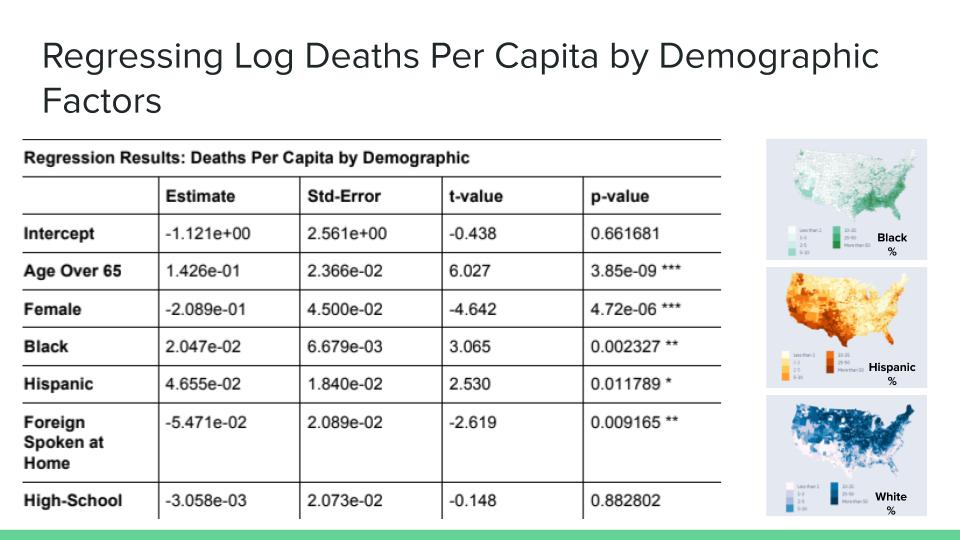
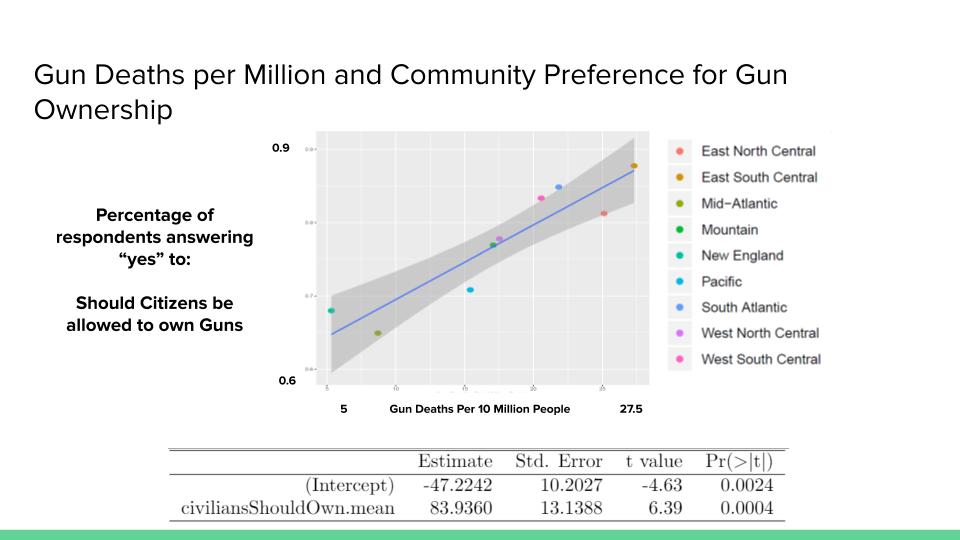
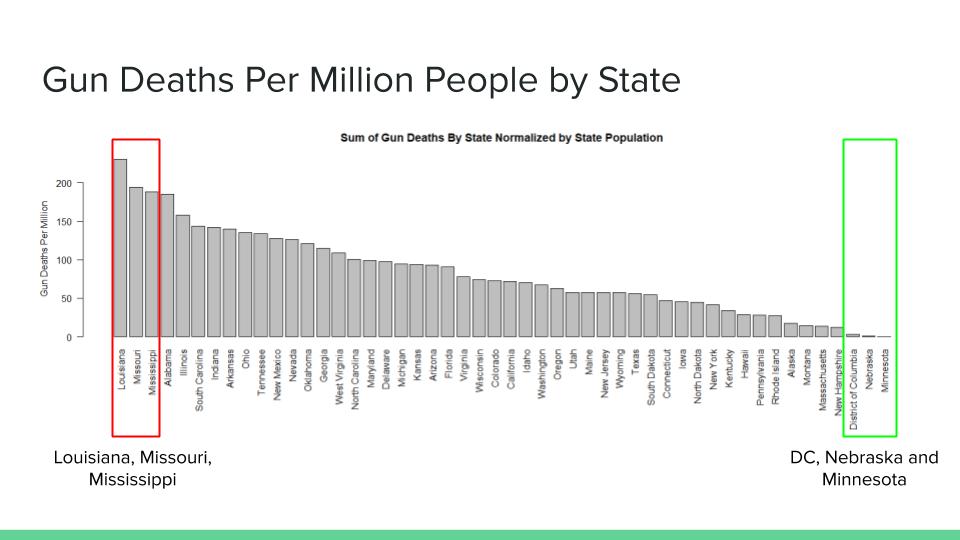
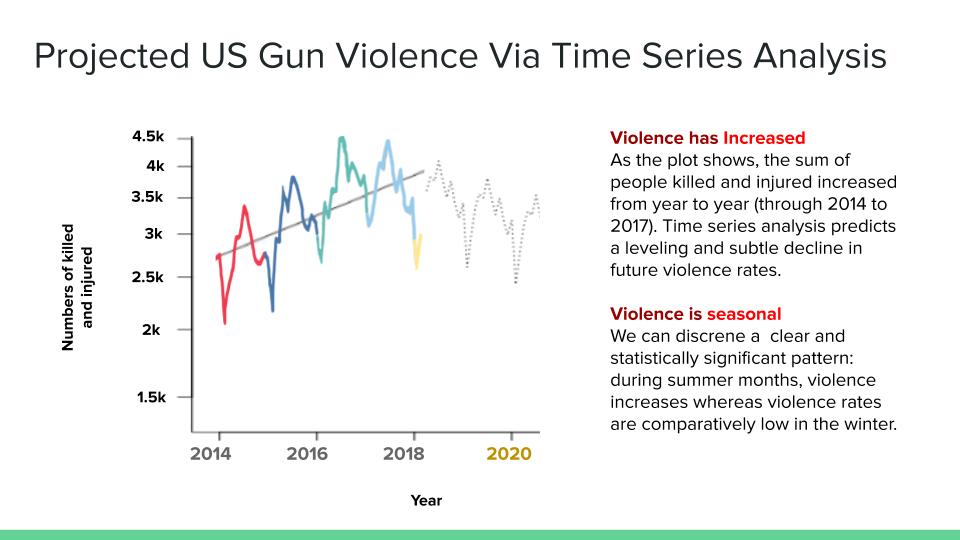
Analysis of Trends in US GUN VIOLENCE
In this report, I studied the impact of demographic factors and attitudes toward guns on US violence rates and found significant relationships for both of these cross sectional questions. Time series analysis was used to identify seasonality in gun violence and predict future gun violence rates.
ALGORITHMIC Product Design
In this personal project I designed a custom parametric script to generate organic growth patterns which can be used to create interesting and highly detailed patterns inspired by nature. In this case, I modeled and rendered a vase with speckled grey (left and center) and dark purple glass (right) with chrome patterning. This type of algorithm is an optimization script and could be used for applications beyond product design.


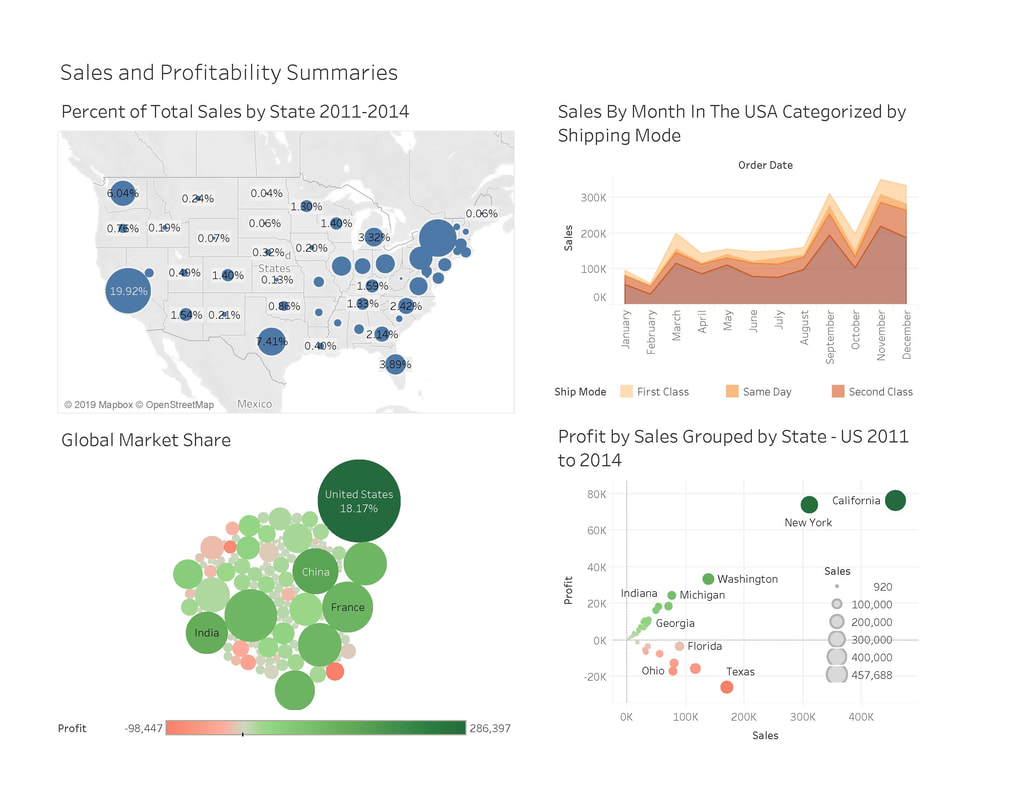
REal Time, Actionable Visualization
In this project, I built a Tableau data dashboard for a consumer goods retail client. This dashboard shows sales and profit summaries aggregated by state, country, and product delivery method. This allows executives to rapidly asses current and past performance while highlighting market opportunities and business risks.
AirBnB EXPLORATORY analysis
|
In this analysis, I worked with a team of four to study AirBnB trends in the Denver metro area. We used price and listings data to quantify the use of AirBnb and investigate trends in price and listing density between neighborhoods. We used multiple regression to estimate appropriate list prices for property owners and investigated neighborhood culture through text mining and sentiment analysis performed on property reviews.
read the full report: https://drive.google.com/file/d/1euh4T-cG1mA-77ot949Yc0_-12-Uh85u/view?usp=sharing |

Map of listing density and price variability | Denver in 2017
|
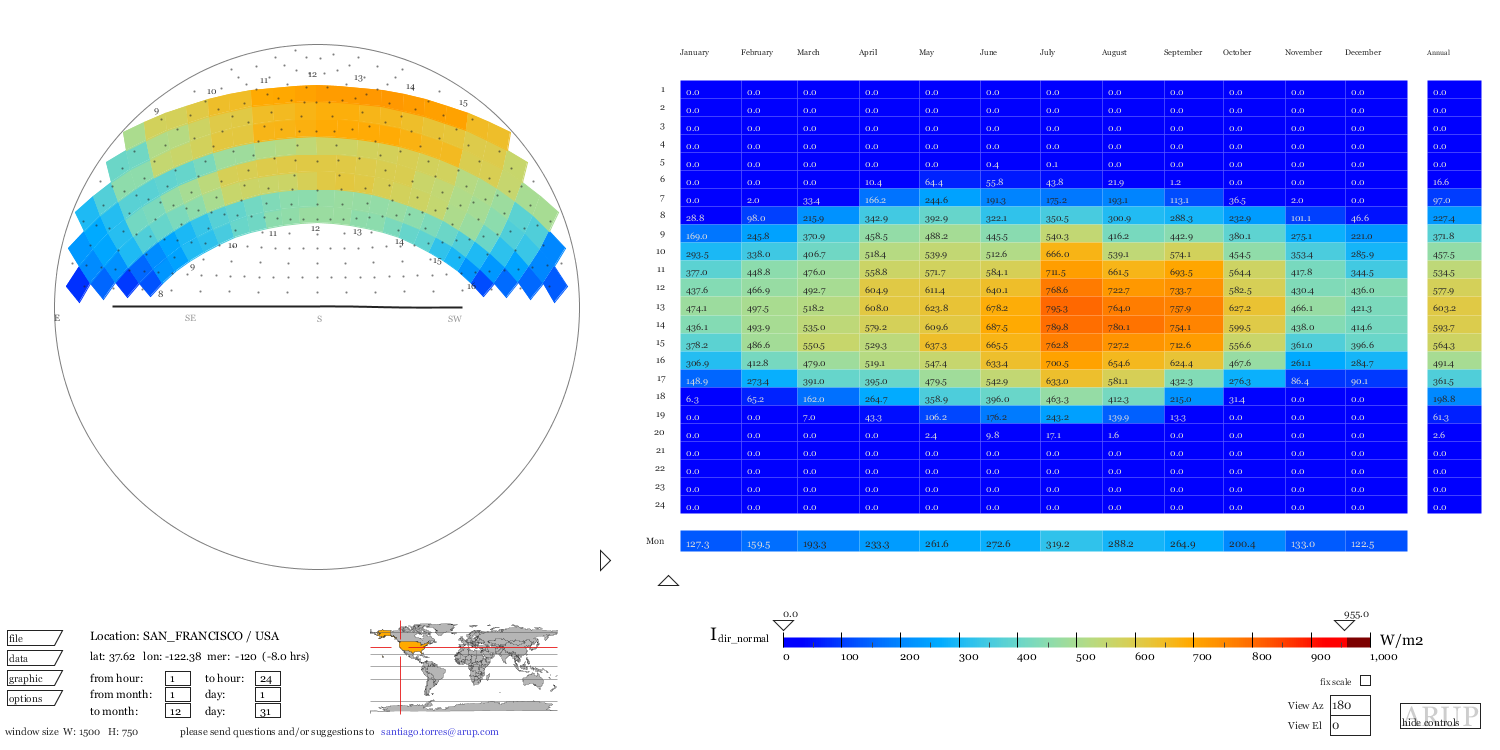
Facade optimization: Climate Analysis for the San FRANCISCO Bay
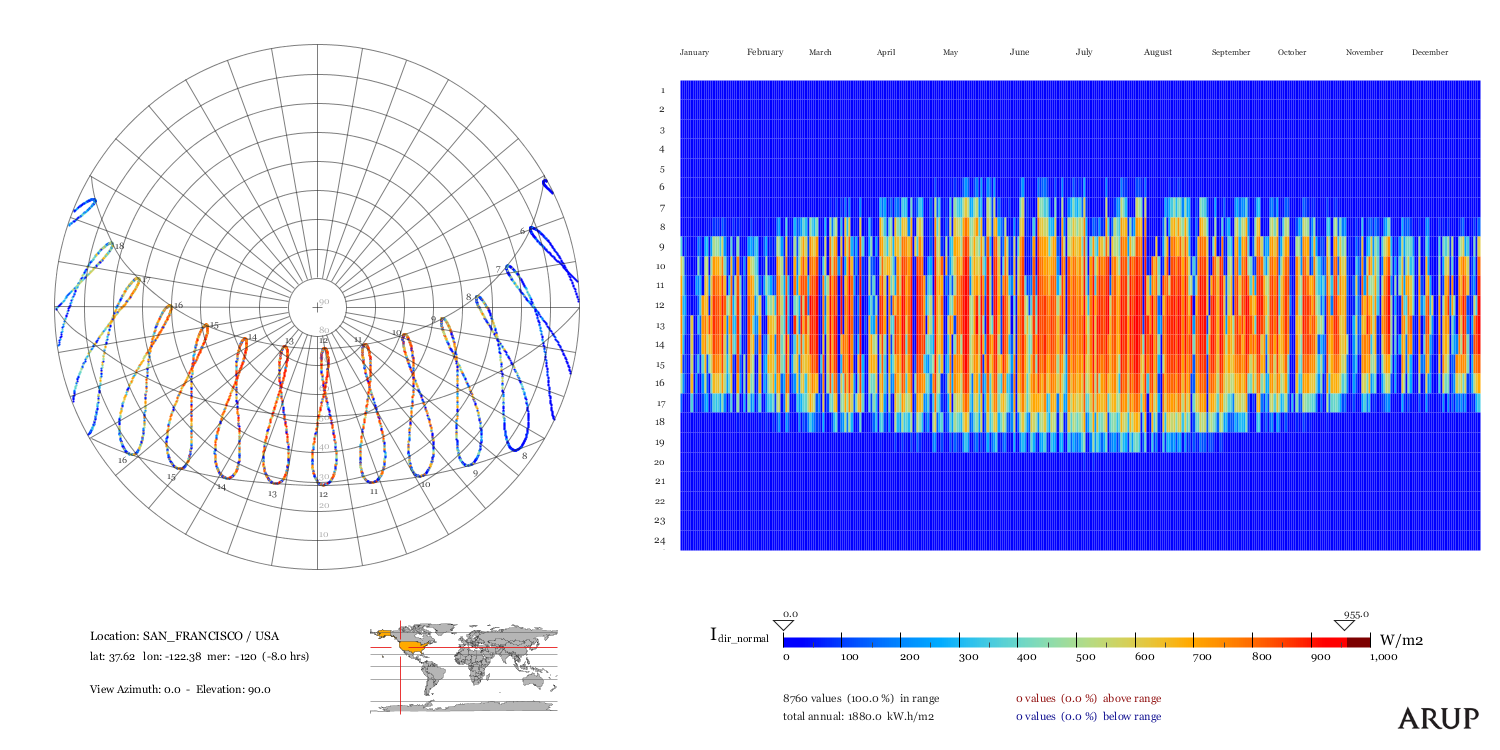
direct sun received in San Francisco annually.
In this analysis I worked with Arup engineers to quantify the radiant solar energy received in San Francisco by direction and time of year. We used those metrics to determine the climate control strategy most appropriate for the renovation of the SFUSD School of the Arts. I investigated the sun exposure for each facade and created guidelines for the design of the facade facing each direction to optimize energy performance and occupant access to daylight and views.
Analysis of the South facade.
|
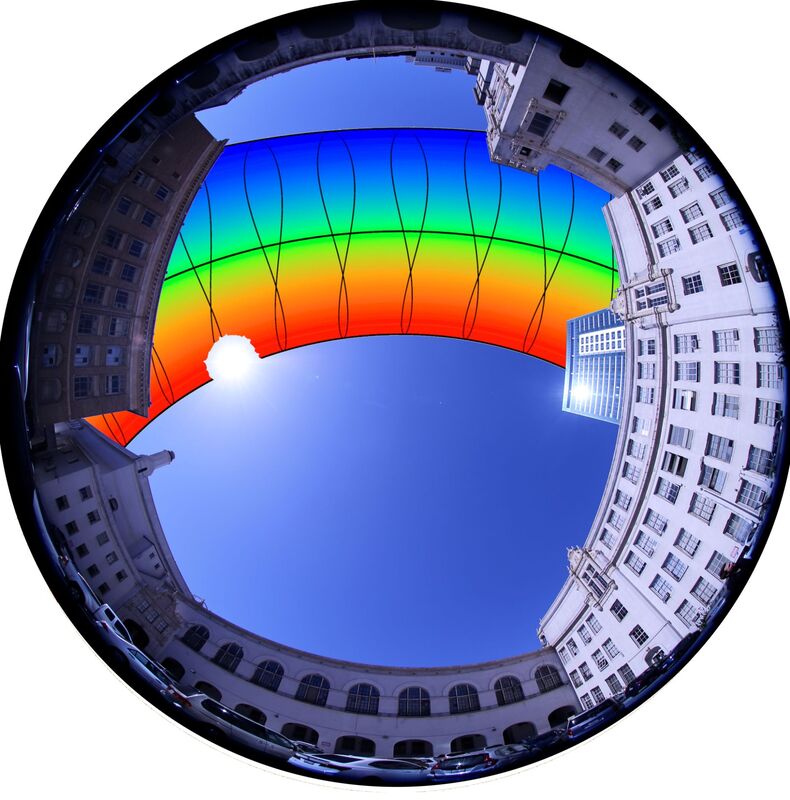
Annual Sun path projected over the SFUSD courtyard.
|
MyanMar Consumer Behavior
In this project I worked with three students to analyse consumer trends in three super markets in Myanmar. I created a decision tree based machine learning model to look at consumer attributes and behaviors correlated with membership to the supermarket. The machine learning analysis demonstrated that the consumption behavior is quite homogeneous across gender and membership status. Business strategy could focus on gender specific marketing and could look at improving the incentives for members to reduce the homogeneity of consumer behavior.
View the full report on github:
https://github.com/MichaelAnth/Myanmar-consumer-analysis
View the full report on github:
https://github.com/MichaelAnth/Myanmar-consumer-analysis
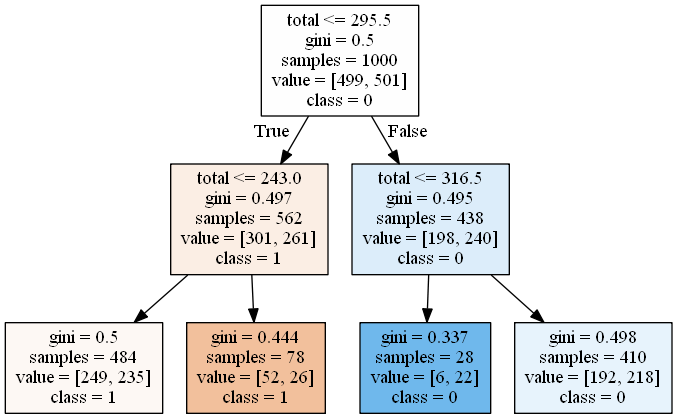
decision tree predicting the gender of a customer. ( 1 )
|
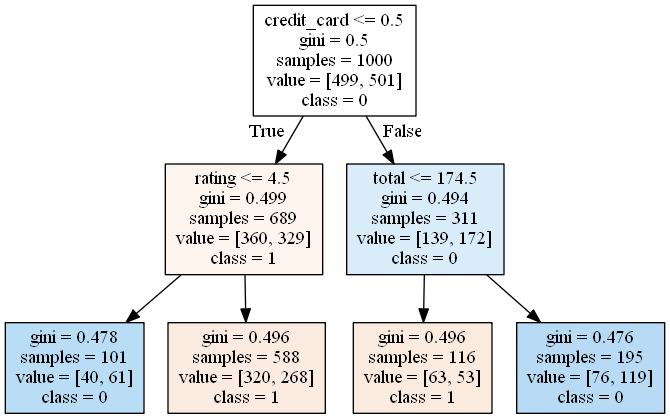
decision tree predicting the membership status of a customer. ( 2 )
|
In the second machine learning model (above right), the algorithm selected credit card use as the parameter most likely to predict if a consumer is or is not a part of the membership program. After this initial watershed, rating and total are the next best predictors with members rating their experience slightly higher and spending less money. These two factors may indicate that the store is offering deals to members which make them buy products at lower prices which reduces their average spending but increases their satisfaction. Although it is somewhat trivial to interpret this chart as predicting whether someone is a member, it can be informative if we interpret it as showing the factors most likely to indicate that someone may be particularly interested in joining the membership program.
